
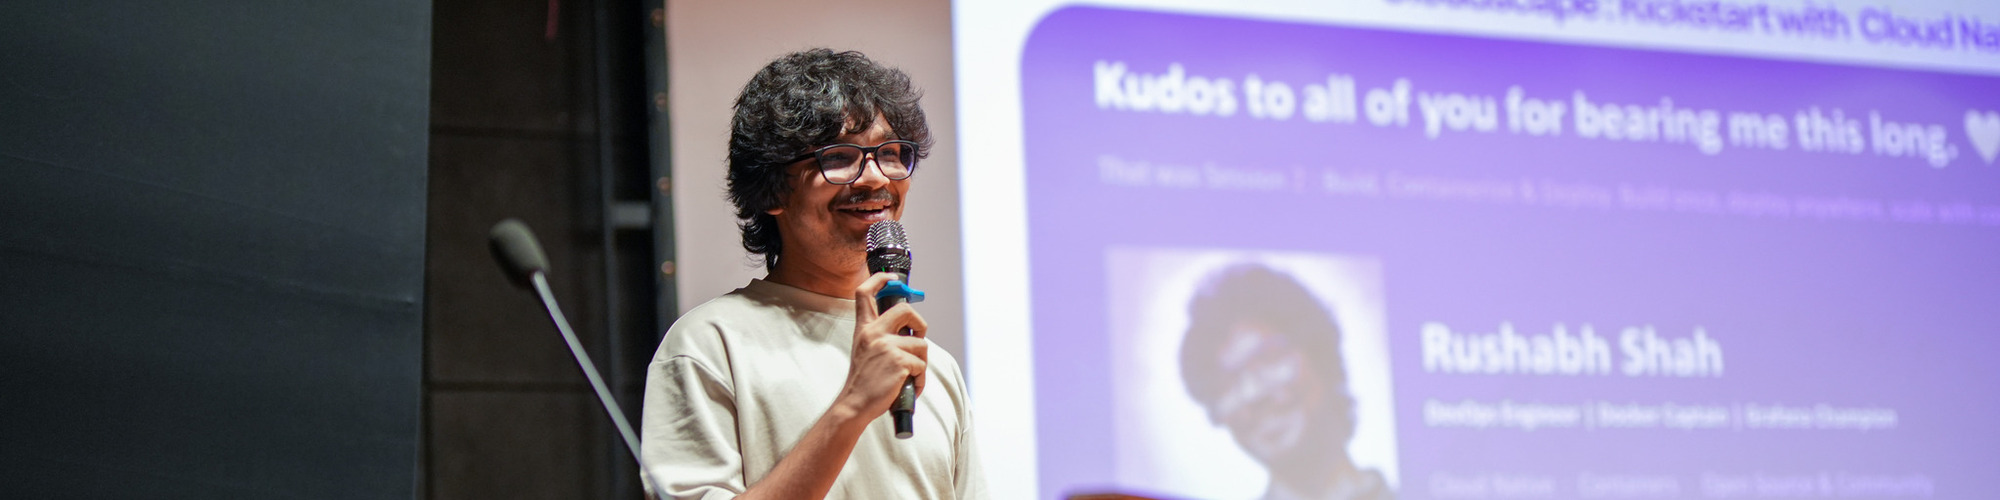

Rushabh Shah
Docker Captain and Grafana Champion. Kubernetes, GitOps and production observability
Ahmedabad, India
Actions
Rushabh Shah is a DevOps engineer in Ahmedabad, India, who runs production Kubernetes for a fintech company. His work centres on GitOps with Flux and Argo CD, and on observability with Prometheus, Grafana, Loki, Tempo and OpenTelemetry. He is a Docker Captain, a Grafana Champion and a Certified Kubernetes Application Developer (CKAD).
In 2026 his talks were accepted at FluxCon North America, Open Source Summit Japan and Open Compliance Summit, and he contributed a recorded segment to a co-presented talk at PromCon EU. He co-organises Grafana & Friends Ahmedabad, serves on the CNCG Gandhinagar core team, was a volunteer and speaker buddy at KCD Gujarat 2026, and translated the eBPF.io website into Hindi. He writes about what he runs at rushabhshah.dev.
Badges

Area of Expertise
Topics
Your Git Repo Is Not a Backup: Kubernetes Disaster Recovery with Flux and Velero
Imagine a pager alert telling you your cluster is completely wiped out. Sure, your workloads and configs are safe in Git, but what about your database PVs and critical secrets? GitOps has changed how we manage infrastructure, but Git alone is not a disaster recovery strategy.
This session explores what it actually takes to recover from a catastrophic Kubernetes failure using Flux and Velero. Through an intentional, live breakdown, we’ll walk the path from total outage back to a healthy state. Along the way, we’ll discuss the undeniable charm of GitOps, as well as its limitations when things go sideways.
We’ll look at how backup and recovery tools map to your GitOps workflow to ensure your clusters run like clockwork. You’ll walk away with a repeatable DR approach for platforms of any size helping you prepare for the days when luck just isn’t on your side.
With Shivani Rathod. Accepted at FluxCon, KubeCon + CloudNativeCon North America 2026, Salt Lake City, 9 Nov 2026.
From Buckets to Native Histograms: Lessons from a Production Migration
Prometheus 3.x finally gives us the tools to make native histogram migrations practical. Features like per-target relabeling, dual scraping of classic and native histograms, improved rate calculations, and performance optimizations mean we no longer have to choose between a risky "big bang" migration or staying on classic histograms forever.
But having the tooling is only half the story.
What does a real migration actually look like? What breaks? What catches teams off guard? And how do you convince everyone that their dashboards aren't broken when their p99 suddenly looks different?
In this session, I'll walk through an end-to-end migration based on real production scenarios—not just the happy path from the documentation. We'll look at how to migrate gradually by running classic and native histograms side by side, validate that both produce the results you expect, and know when it's safe to switch over.
Along the way, we'll explore how the new Prometheus 3.x capabilities make this possible, compare how latency graphs change with the newer rate calculations, and look at the performance improvements in the storage layer, including the latest WAL and TSDB optimizations.
We'll also spend time on the less glamorous parts of migration: Grafana dashboards that suddenly look unfamiliar, exporters that aren't quite ready, and the conversations you'll inevitably have when someone says, "Our latency metrics are wrong."
By the end of the session, you'll have a practical migration strategy, a set of validation techniques you can use in your own environment, and a realistic understanding of both the benefits and the challenges of moving to native histograms.
By the end of this session, attendees will be able to:
Plan a phased migration from classic to native histograms with minimal risk.
Validate native histograms using practical PromQL before production rollout.
Understand how Prometheus 3.x changes scraping, storage, and query behavior.
Avoid common migration pitfalls in dashboards, alerts, and exporters.
Communicate why latency metrics may change after migration and why they're more accurate.
Co-presented with Shivani Rathod at PromCon EU 2026, Munich, 8 Oct 2026. Rushabh's part was a pre-recorded segment.
Open Compliance Summit 2026 Sessionize Event Upcoming
SONiC Workshop at ONE Summit Japan 2026 Sessionize Event Upcoming
Open Source Summit Japan + Automotive Linux Summit + Embedded Linux Conference Asia 2026 Sessionize Event Upcoming
CNCF-Hosted Co-located Events North America 2026 Sessionize Event
PromCon EU 2026 Sessionize Event
Cloud Native Vadodara: KCD Gujarat pre-event meetup
Talk: "Agents in the Dark", observability for AI agents with OpenTelemetry, Prometheus, Loki and Tempo. Also demonstrated the same agent telemetry in OpenObserve.
Cloudscape: Kickstart with Cloud Native, Parul University
Workshop: "Build, Containerize and Deploy". Run by the AWS Student Builder Group at Parul University with KCD Gujarat and CNCG Ahmedabad.
Grafana & Friends Ahmedabad: Beyond Dashboards
Talk: "How Not to Become a Grafana Champion". Also co-hosted the meetup.
Grafana & Friends Ahmedabad (co-organiser)
Co-organiser of the Grafana & Friends Ahmedabad community. Hosted or co-hosted 7 meetups.
Cloud Native Ahmedabad x Grafana Ahmedabad cross meetup
Talk: "Level Up Your Monitoring: Grafana 101 for Everyone".
Rushabh Shah
Docker Captain and Grafana Champion. Kubernetes, GitOps and production observability
Ahmedabad, India
Actions
Please note that Sessionize is not responsible for the accuracy or validity of the data provided by speakers. If you suspect this profile to be fake or spam, please let us know.
Jump to top