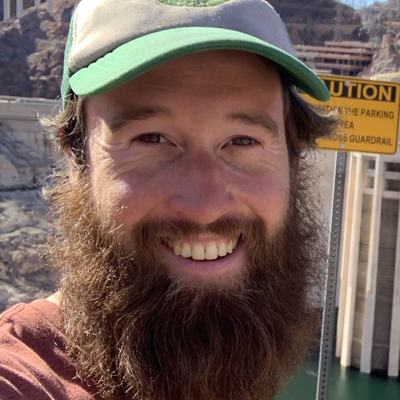
Jennings Anderson
University of Colorado Boulder
Boulder, Colorado, United States
Actions
Jennings builds and extends OSM data analysis tools that explore questions of who, when, and how in addition to what and where was edited. He hopes these tools can better our understanding of the evolution of both the map and the community behind it.
Links
Area of Expertise
Topics
Corporate Editors in the Evolving Landscape of OpenStreetMap
OSM is characterized both by its map as well as the active community of the millions of mappers who produce it. Recently, many large corporations have been hiring editors to contribute to the OSM database.
We recently explored the influence these corporate editors are having on the map by first considering the history of corporate involvement in the community and then analyzing historical quarterly-snapshot OSM-QA-Tiles to show where and what these corporate editors are mapping. We found that cumulatively, millions of corporate edits have a global footprint, but corporations vary in geographic reach, edit types, and quantity. While corporations currently have a major impact on road networks, non-corporate mappers edit more buildings and points-of-interest: representing the majority of all edits, on average.
Corporate editors represent just the latest stage in the evolution of corporate involvement. We therefore raise questions about how the OSM community—and researchers—might proceed as corporate editing grows and evolves as a mechanism for expanding the map for multiple uses.
Postcards from the Edge: A Tour of OSM Data Analyses + Visualizations
OpenStreetMap data analysis continues to be a popular and well-attended topic at State of the Map conferences. Each year the community builds and presents a new generation of tools that help us reimagine how we approach OSM data analysis and stretch the realm of what is possible when it comes to measuring the millions of edits and the growing community that make OSM (On average, we’re now more than 4,700 daily mappers!). This year is no different: The community has been iterating on analysis platforms and producing new data visualizations to tell more stories. We observe this happening across industry, academia, and at home.
This year we propose a show-and-tell session of OSM data visualizations and processes by which they were produced to get a better picture of where OSM data science currently sits. For this, we will curate and present a number of visualizations as produced by the various OSM data science tools out there. Depending on the number of items, we will briefly describe each one, the story it tells, and the techniques used to create it. How often do you see a new visualizations shared to social media and think, “Wow! That’s really cool, how can I recreate that for a different part of the map?” This session seeks to collect many of these and briefly explain the processes behind each one.
Over the next few months, we will reach out to the community, search blogs and academic publications, and dig into our own collections for the most interesting and compelling OSM data-visualizations, both cartographic and not. We will get the story behind them of why and how they were produced. In this way, we hope to share and acknowledge all of the great work out there that is not otherwise being represented at the conference.

Jennings Anderson
University of Colorado Boulder
Boulder, Colorado, United States
Links
Actions
Please note that Sessionize is not responsible for the accuracy or validity of the data provided by speakers. If you suspect this profile to be fake or spam, please let us know.
Jump to top