
Manoj Sardana
Director Of Information System and Operations - HCL Software
Delhi, India
Actions
With over 20 years of IT experience, I am Director of operations and information Systems at HCLSoftware, where I lead a team to manage the availability, reliability, and performance of SaaS-based solutions on AWS, GCP, and IBM Cloud. I have extensive experience on cloud native tools like Kubernetes, Docker, Istio, OpenTelemetry and observability tools like Dynatrace, new relic and Grafana. I am a firm believer of automating most operational tasks by defining standard processes and practices.
Badges
Area of Expertise
Topics
Kem Cho, OTel Collectors? Time to Meet Your Control Plane
As OpenTelemetry adoption grows, many organizations run hundreds of OpenTelemetry Collectors across Kubernetes clusters as DaemonSets, sidecars, and gateways. In real environments, these collectors rarely share a single configuration, each requires different receivers, processors, exporters, and filters based on workload, team, or regulatory needs.
Multiple configuration's YAML sprawl leads to drift, small changes require risky redeployments, and teams lack a centralized view of collector health, versions, and active pipelines. These problems are even harder in regulated or air-gapped environments.
In this session, we show how OpAMP (OpenTelemetry Agent Management Protocol) provides a centralized control plane for OpenTelemetry Collectors, enabling dynamic configuration updates, fleet-wide visibility, and safe rollouts at scale. We’ll also discuss how OpAMP complements GitOps and helps teams scale observability without turning collector management into an operational bottleneck.
The OpenTelemetry Scaling Handbook: Practical Lessons from the Field
As OpenTelemetry becomes the backbone of observability for cloud-native systems, scaling its adoption across diverse teams and architectures presents unique challenges. From managing collector configurations across environments to ensuring consistent schemas and maintaining collector health, platform and SRE teams often face a chaotic operational landscape.
In this session, we’ll explore real-world strategies for orchestrating OpenTelemetry at scale using GitOps principles. You’ll learn how to define reusable component templates for exporters, processors, receivers, and connectors parameterized to adapt to varying workloads. We’ll demonstrate how to dynamically create and deploy processors based on runtime needs and OTTL standard syntax and how we standardized observability across multiple teams and product lines. The session will be based on our real time experience managing hundreds of collectors running across multiple product SaaS deployment.
We’ll also showcase the use of OpAMP for real-time collector health monitoring and remote configuration management eliminating much of the manual overhead traditionally associated with large-scale observability infrastructure.
Offline but Not Blind: Observability in Air-Gapped Kubernetes Environment
In many regulated industries, especially across India, not every Kubernetes cluster runs in the cloud. Banks & government systems often operate air-gapped Kubernetes clusters with no internet access. In these environments, SaaS-based observability assumptions does not hold good &Observability becomes core Kubernetes infrastructure, not a service.
This session explains why air-gapped K8s environments matter and outlines the challenges they introduce, including constrained scaling, offline upgrades, local image management, and storage-bound observability pipelines.
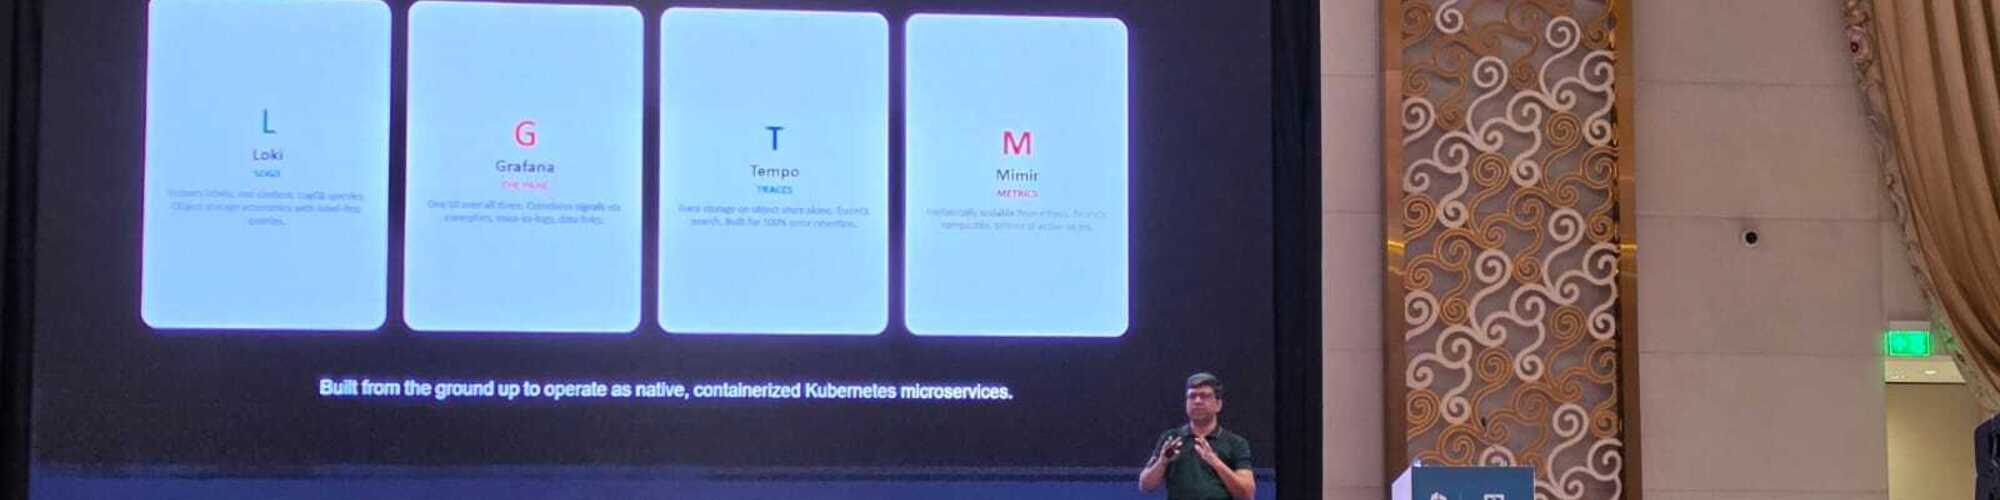
We then walk through a real-world journey of building K8s observability in an air-gapped setup using OpenTelemetry and self-hosted LGTM stack (Loki, Grafana, Tempo, Mimir). The talk covers in-cluster telemetry design, cardinality control, offline upgrades, autoscaling without internet and operating observability components as first-class Kubernetes workloads, followed by practical limitations and operational best practices.
From Noise to Signal: Building Smart Observability Pipelines with OpenTelemetry
Cloud-native systems generate massive volumes of telemetry signals for metrics, logs, and traces, but more data does not always improve observability. Many teams struggle with noisy signals and poorly designed pipelines that increase storage costs and flood engineers with low-value alerts.
In this hands-on workshop, we focus on building effective, noise-free telemetry pipelines using OpenTelemetry Collector, with the LGTM stack (Loki, Grafana, Tempo, and Mimir) as the backend observability platform. Participants will deploy collectors and design pipelines using processors such as filter, transform, and attributes, along with OTTL (OpenTelemetry Transformation Language) for fine-grained filtering and signal transformation. We will also demonstrate tail-based sampling for traces and routing processors to selectively direct telemetry to appropriate backends, helping control signal volume and storage cost.
By the end of the workshop, attendees will gain practical experience designing OpenTelemetry pipelines that prioritize signal quality over quantity using various filtering and processing techniques.
Building an effective observability pipelines for application deployed on Kubernetes
Modern cloud-native applications generate massive amounts of telemetry data, and managing this data efficiently is critical for reliable operations. This hands-on workshop is designed to help participants set up the OpenTelemetry Collector and learn how to build optimized telemetry pipelines that are scalable, cost-efficient, and ready for production use.
This session is ideal for SREs, DevOps engineers, and platform teams looking to strengthen their Observability foundations.
outcomes :
Deploy and configure an OpenTelemetry Collector
Build and customize telemetry pipelines
Apply effective filtering and processing strategies
Optimize data flow to reduce noise and improve Observability quality
AIOps - Role of AI in Observability
As modern applications evolve into complex, distributed ecosystems, traditional observability approaches struggle to keep pace with the scale, speed, and dynamic nature of microservices. AI-powered observability offers a transformative approach, enabling organizations to move beyond manual monitoring and reactive troubleshooting. By leveraging machine learning models, anomaly detection, and intelligent correlation, AI enhances observability pipelines—automating root cause analysis, predicting incidents before they escalate, and optimizing system performance in real-time.
This session explores how AI augments observability by integrating with OpenTelemetry and other telemetry data sources to provide deeper insights, proactive alerts, and automated remediation.
Join us to discover how AI is reshaping observability, making modern systems more resilient, efficient, and intelligent.
Bridging K8s Observability and Intelligence with AIOps and OpenTelemetry
OpenTelemetry provides a unified framework for collecting, processing, and exporting telemetry data, enabling visibility across diverse systems and environments including K8s based microservices.
AIOps (Artificial Intelligence for IT Operations) leverages AI and machine learning to automate and enhance IT operations, improving incident management, performance monitoring, and decision-making at scale.
When paired together , OpenTelemetry’s rich data becomes a powerful foundation for advanced analytics, anomaly detection, and automated incident response through AIOps techniques. Training the right model on the existing Observability data and various other data sets like past incidents, user interaction & feedback, action taken etc. can help the operation reach a level of fully autonomous with close to zero human interaction.
The session will cover the high level overview of high standardization of OpenTelemetry and help in realizing the dream of AIOps, a fully autonomous operations world.
Building Effective Observability Pipelines for Applications on Kubernetes
Modern cloud-native systems generate tons of telemetry data, and understanding how to manage, process, and optimize this data is essential for any SRE, DevOps, or platform engineer.
In this workshop, you’ll learn how to:
✅ Deploy & configure the OpenTelemetry Collector
✅ Build and customize telemetry pipelines
✅ Apply filtering & processing strategies
✅ Optimize signal flow to reduce noise and improve observability quality
This session is packed with practical knowledge to help you strengthen your observability foundations and apply industry best practices.
Please note that Sessionize is not responsible for the accuracy or validity of the data provided by speakers. If you suspect this profile to be fake or spam, please let us know.
Jump to top