
Session
Beyond the green checkmark: Data observability and monitoring in Microsoft Fabric
"These numbers don’t add up—yesterday's data is completely missing."
A message pops up, a chill runs down your spine, you log in to the service and everything looks pristine, green checkmarks everywhere. Yet downstream, the reports are broken.
Does this sound familiar?
That little green tick is one of the biggest illusions in data engineering. Schedulers and orchestrators only validate that a job didn't crash—they don't care if an upstream API returned zero rows, a silent schema drift filled a column with NULLs, or data has been stale for days. In an ecosystem like Microsoft Fabric, where different engines coexist across multiple workspaces, relying solely on operational checkmarks is a blind spot.
In this talk, we’ll move beyond basic pipeline monitoring and build an end-to-end data observability strategy inside Fabric. We will break down:
• Execution vs. payload health: Why operational green checkmarks miss zero-row runs, staleness, and silent schema drift.
• Fabric’s native naps: What workspace monitoring, KQL tables, and diagnostic emitters cover out-of-the-box—and where their blind spots begin.
• Fail-fast ingestion patterns: Practical patterns to embed data contracts, assertions, and structured telemetry directly into your pipeline code.
• Centralized observability: How to route fragmented telemetry into a central repository to unlock unified anomaly detection and single-pane alerting across workspaces.
From making sure jobs don’t crash to ensuring the data is actually right: real observability in Microsoft Fabric.
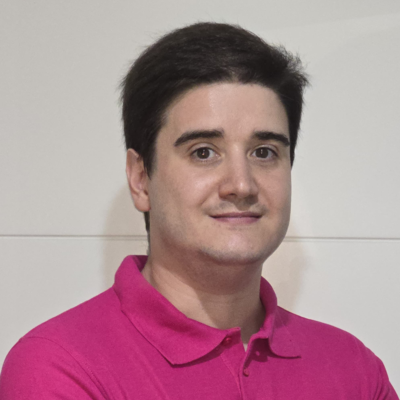
Rafael Báguena Girbés
Microsoft Data Platform MVP | Data Engineer @ Plain Concepts
Valencia, Spain
Links
Please note that Sessionize is not responsible for the accuracy or validity of the data provided by speakers. If you suspect this profile to be fake or spam, please let us know.
Jump to top