
Session
Your Pod Is Healthy, Your Agent Is Not: Tracing Agent Behavior End-to-End With OpenTelemetry
A pod can look perfectly healthy on every dashboard while the agent inside it loops through [4,000] tool calls overnight, hands a task to a second agent that silently drops the context, and burns [$X] in tokens before anyone notices. These are behavioral failures, not infrastructure failures, and the request/response trace model most teams run today was never designed to capture them.
This session shows how to instrument a multi-agent system on Kubernetes with OpenTelemetry so that decisions, not just requests, become observable. Using an open-source agent framework, the OpenTelemetry Collector, and an open-source backend, we walk through the GenAI semantic conventions as they stand today, then go past them: propagating context across MCP tool calls and agent-to-agent handoffs, modeling loops and retries as span trees, attributing tokens and cost to the agent step and Kubernetes namespace that caused them, and correlating agent spans with inference-gateway and GPU signals to separate “the model is slow” from “the agent is thrashing.”
Attendees will leave with a reference instrumentation pattern, Collector pipeline configuration for aggregating and sampling agent telemetry, and a clear picture of where the conventions still fall short and how to feed those gaps back to the project.
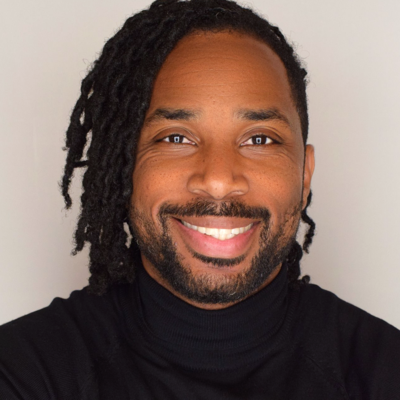
Jemiah Sius
New Relic | Senior Director, Developer Relations
Miami, Florida, United States
Links
Please note that Sessionize is not responsible for the accuracy or validity of the data provided by speakers. If you suspect this profile to be fake or spam, please let us know.
Jump to top