
Session
Tracing Agents in Production with OpenTelemetry
Your agent passed every test and shipped. Two weeks later, someone asks why it approved something it should not have—and the logs cannot explain the decision. Infrastructure monitoring says the service was healthy, but a black box made the wrong call.
Traditional telemetry—latency, error rate, and uptime—shows whether an agent is running. It does not show which context it received, which tools it called, how much each step cost, or where a multi-step decision drifted. This talk builds an agent-observability layer from the ground up with OpenTelemetry. A live failure moves from mystery to trace: instrument the reasoning boundary, capture tool calls and handoffs, correlate cost and latency, and follow the decision to its root cause.
Attendees will leave able to distinguish infrastructure monitoring from agent tracing, instrument an agent pipeline, troubleshoot a failed decision, and define the minimum observability required before an agent reaches production.
Audience: Engineers and technical leads operating agent systems in or near production.
Format: 60–75-minute technical talk with a live tracing demonstration.
Demo: Microsoft Agent Framework on Azure instrumented with OpenTelemetry; concepts transfer to other runtimes.
Evidence: New session; currently in evaluation for Visual Studio Live! Las Vegas 2027.
Materials: Talk-specific repository, slides, and recording are not yet published.
Vendor scope: Vendor-neutral observability model with a Microsoft implementation.
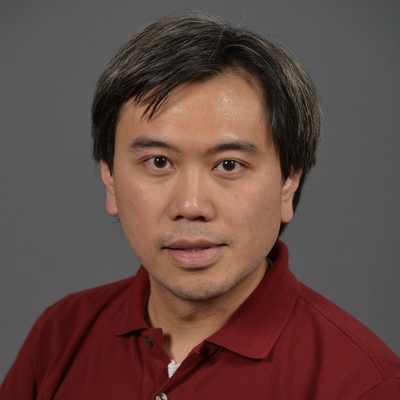
Ron Dagdag
Microsoft MVP / Research Engineering Manager @ Thomson Reuters
Fort Worth, Texas, United States
Links
Please note that Sessionize is not responsible for the accuracy or validity of the data provided by speakers. If you suspect this profile to be fake or spam, please let us know.
Jump to top