
Mihaly Kavasi
Fasttrack Recognized Solution Architect, MCT, Founder of One Day BI
Fasttrack Recognized Solution Architect, MCT, Founder of One Day BI
Southampton, United Kingdom
Actions
Mihaly Kavasi is a Microsoft Certified Trainer, Fast Track Recognised Solution Architect for Power BI, and Founder of OneDayBI — a UK consultancy helping small and mid-sized businesses turn data into daily decisions.
Over a decade of enterprise data work, most recently as Group Manager Delivery Lead and Trainer at Avanade (Microsoft's largest global partner), shapes how he speaks: practical, jargon-free, and grounded in what actually ships. He has spoken at Data Scotland, Budapest BI Forum, and runs selfservicebi.co.uk — a blog read by data analysts and decision makers on AI-assisted report development, governance, and what it really takes to make Self-Service BI work in practice.
Recent talks cover building context for AI agents in Power BI, sub-agent architectures for report development, and the operational realities of governance at SME scale.
Links
Badges


Area of Expertise
Topics
Rise of the Data Builder: Agentic AI and the Future of Fabric Engineering en
The lines between data engineer, AI engineer, and software engineer are blurring. Agentic coding tools are reshaping who builds the data platform — and a new data builder role is emerging at every team size, from Microsoft engineering to small client teams in the field.
This full-day workshop pairs two perspectives: how a Microsoft data engineering team is adopting GitHub Copilot and agentic workflows for Fabric, and field-tested adaptations from solution architecture work with client teams who lack Microsoft's scale.
What you'll master:
- Apply agentic coding patterns to Fabric notebooks, Spark, and Lakehouse pipelines in production
- Configure GitHub Copilot, MCP servers, and reusable skills for Fabric data engineering
- Architect end-to-end agentic pipelines spanning ingestion, transformation, testing, and observability
- Adopt patterns a Microsoft team uses at scale — and adaptations proven with smaller client teams in the field
- Position your career for the unified data builder role replacing siloed engineer titles
Walk away with a working agentic toolkit, production and field case studies, and a clear view of where engineering roles are heading.
Building Context, Not Vibes Practical AI Augmented Data Engineering en
Many data professionals have experimented with AI coding assistants, only to find the results inconsistent. AI outputs seemingly relying more on "vibes" rather than solid engineering principles. To transform these tools from novelty chatbots into reliable workflow multipliers, developers must abandon simple prompt engineering in favor of systematic Context Engineering.
This session cuts through the noise of AI terminology to demonstrate a practical, battle tested, end-to-end Agentic Workflow. We will ignore the theoretical buzzwords and build a live, production-ready data platform from raw source to a Medallion architecture, finishing with a published Power BI dashboard. We will demonstrate exactly how to orchestrate AI agents, leveraging Model Context Protocol (MCP), skills, custom personas, and specific tool integrations to handle complex data pipelines.
You will leave with a concrete understanding of:
- Context Engineering: Mastering the shift from "asking" the AI to "architecting" the AI's environment for reproducible results.
- Configuring and customising agentic tools (like GitHub Copilot or Claude) with specific personas and skills to level up your existing work
- How to Deliver a data platform solution (Ingestion → Silver/Gold → Reporting) purely through AI augmented workflows.
- Identifying which parts of the "Agentic" landscape are hype and which are essential for accelerating outcomes.
Optimize data preparation with Power Query Best Practices en hu
Data preparation is a fundamental part of data modelling. In this session we will explore best practices to make your data transformations:
- robust = fewer refresh failures
- leaner = smaller dataset size
- dynamic = automatically adjust to data changes
- cleaner = better data quality
- structured = easier to understand and debug
This is a hands-on session where you can follow along the step on a prepared dataset.
Best if you have a basic understand of the Power BI query editor
Fabric Notebooks for Power BI Developers: Bridge the Python Gap en
Your SQL and DAX skills are the perfect foundation for stepping into Microsoft Fabric and data engineering. Fabric Notebooks are your gateway—combining a familiar data mindset with Python, Spark, and the Lakehouse to unlock powerful new capabilities. Discover how your existing BI expertise translates naturally into the data engineering world without starting from scratch.
What you'll master:
- Master Fabric Notebooks confidently understanding the interface, Lakehouse architecture, and Spark execution model—your first hands-on step into data engineering
- Translate SQL and DAX knowledge to Python using side-by-side syntax comparisons that make the transition feel natural
- Build Lakehouse data pipelines combining Bronze, Silver, and Gold layers with Notebooks for scalable data transformation
- Query semantic models programmatically with SemPy to automate DAX evaluation, model analysis, and data profiling across millions of rows
- Automate repetitive BI and engineering tasks using Python scripts for documentation, testing, data quality checks, and model validation
Take your first confident step from BI into data engineering—your next career leap starts with the skills you already have.
- Target Audience: Power BI developers expanding into Fabric and data engineering, BI analysts ready to add Python to their toolkit
- Format: 45-minute talk or full-day hands-on workshop
- Takeaways: SQL-to-Python cheat sheet, SemPy starter notebooks, Lakehouse pipeline templates, data profiling scripts
- Prerequisites: Intermediate Power BI development experience, basic SQL knowledge
- Level: Intermediate
- Topics Covered: Microsoft Fabric, Fabric Notebooks, Python, PySpark, SemPy, Lakehouse, Data Engineering fundamentals
Optimize Power BI Models: Master Tools & Techniques for Peak Performance hu en
Slow reports kill user adoption. Discover the systematic approach to diagnosing and eliminating Power BI performance bottlenecks using a comprehensive toolkit of expert-grade, free tools.
What you'll master:
• Identify visual-level bottlenecks using Performance Analyzer to pinpoint exactly where reports slow down
• Optimize DAX queries with DAX Studio and DAX Query View, achieving 5-10x speed improvements
• Automate model quality checks using Tabular Editor for consistent, maintainable implementations
• Monitor production workloads with SQL Server Profiler and Azure Log Analytics for proactive issue detection
• Stress-test at scale using the Power BI Load Testing Tool before production deployment
• Apply proven optimization patterns for common performance killers (relationships, calculations, visuals)
You'll leave with a clear, actionable framework for analyzing and optimizing any Power BI model, plus downloadable tools and scripts you can use immediately.
Target Audience: Experienced Power BI developers and data modelers
Format: 60-minute session or 2-4 hour hands-on workshop
Takeaways: Optimization checklist, tool configuration templates, sample PBIX files
Prerequisites: Intermediate Power BI development experience
Tools: All tools featured are free and immediately accessible
Excel + Power BI: Your Gateway to Organization-Wide Data Adoption en hu
Excel remains the world's most widely used analytics tool, yet most organizations underutilize its true potential. Discover how connecting Excel to Power BI semantic layers transforms everyday Excel users into self-service analysts—eliminating IT bottlenecks and accelerating data-driven decision making across your entire organization.
What you'll master:
• Access Power BI semantic layers directly from Excel using multiple connection methods optimized for different user personas
• Design semantic layer best practices specifically for Excel users, including Detail Rows Expression and MDX availability settings
• Build dynamic, interactive dashboards in Excel using MDX formulas that rival traditional BI visualizations
• Leverage hidden Excel settings that dramatically improve usability and performance for connected workbooks
• Enable scalable self-service analytics where business users create their own reports without IT intervention
You'll leave with immediately applicable strategies to multiply your data's value, reduce time-to-insight from days to minutes, and empower every Excel user in your organization to become data-driven.
Target Audience: BI developers, data architects, analytics leaders, and Excel power users
Format: 45-minute session or 2-4 hour hands-on workshop
Takeaways: Connection templates, semantic layer design checklist, Excel configuration guide, sample workbooks
Prerequisites: Basic understanding of Excel and Power BI fundamentals
Technologies: Power BI, Excel, Azure Analysis Services
Journey to Agentic Report Development en hu
Embark on the evolution from traditional report building to autonomous development! Join Mihaly Kavasi, Group Manager Delivery Lead and Trainer at Avanade, as he guides you through the transformative landscape of AI-powered Power BI development.
In this forward-looking session, you'll discover:
How the new PBIR format unlocks unprecedented possibilities for AI-assisted development
Progressive techniques from AI code completion to fully agentic development workflows
Live demonstrations of Claude Code's agentic capabilities in report creation
Real-world implementation strategies and current challenges in autonomous development
Experience live demos showcasing the spectrum of AI assistance—from intelligent code suggestions to autonomous agentic tools that can independently architect and build complex reports.
As Power BI embraces code-first methodologies, position yourself at the forefront of this revolution. Learn how agentic development tools are reshaping the entire development lifecycle, dramatically reducing time-to-delivery while elevating report sophistication and maintainability.
This isn't just about faster coding—it's about reimagining what's possible when AI becomes your development partner.
This session can be delivered as a 45-min talk or 2-4 hour workshop.
Unlock Self-Service Analytics: Master the Human & AI-Friendly Semantic Layer en hu
Transform your organization's data strategy by mastering the essential bridge between IT and Business. This session reveals how to build semantic layers that empower both human users and AI assistants (including Copilot) to extract maximum value from your data assets.
What you'll master:
• Implement optimal responsibility division between IT/BI teams and business users for scalable self-service
• Design semantic layer structures that balance usability, performance, and AI compatibility
• Optimize naming conventions and metadata specifically for Copilot and AI assistant readability
• Leverage advanced model features (field parameters, perspectives, calculation groups) that accelerate report creation
• Apply performance optimization techniques that deliver instant insights even with billions of rows
• Master code-first semantic layer design using TMDL and modern development workflows
• Train AI Coding Agents to efficiently implement these improvements
You'll build semantic layers that slash report development time by 60%, eliminate IT bottlenecks, and position your organization for success in the AI-augmented analytics era.
Target Audience: BI developers, data architects, analytics leaders
Format: 30-minute lightning talk, 60-minute session, or 2-4 hour hands-on workshop
Takeaways: Semantic layer design checklist, naming convention guide, Copilot optimization templates
Level: Intermediate to advanced Power BI/Fabric developers
Topics Covered: Power BI, Microsoft Fabric, Azure Analysis Services, AI Coding Agents
Journey to Agentic Report Development en hu
Embark on the evolution from traditional report building to autonomous development! Join Mihaly Kavasi, Group Manager Delivery Lead and Trainer at Avanade, as he guides you through the transformative landscape of AI-powered Power BI development.
In this forward-looking session, you'll discover:
How the new PBIR format unlocks unprecedented possibilities for AI-assisted development
Progressive techniques from AI code completion to fully agentic development workflows
Live demonstrations of Claude Code's agentic capabilities in report creation
Real-world implementation strategies and current challenges in autonomous development
Experience live demos showcasing the spectrum of AI assistance—from intelligent code suggestions to autonomous agentic tools that can independently architect and build complex reports.
As Power BI embraces code-first methodologies, position yourself at the forefront of this revolution. Learn how agentic development tools are reshaping the entire development lifecycle, dramatically reducing time-to-delivery while elevating report sophistication and maintainability.
This isn't just about faster coding—it's about reimagining what's possible when AI becomes your development partner.
This session can be delivered as a 45-min talk or 2-4 hour workshop.
Agentic Development for Analytics: Build Your AI Toolkit with Subagents, Skills, and MCP en
AI agents are transforming how we build analytics—but where do you start, and how do you go from setup to real productivity? This session takes you on the full journey: from configuring your AI development environment to orchestrating specialized subagents that autonomously handle data pipelines, semantic models, and quality monitoring.
What you'll master:
- Master the AI tool landscape differentiating agents, copilots, and chatbots to choose the right tool for each analytics task
- Configure VS Code with GitHub Copilot and Claude Code, and connect MCP servers giving agents direct access to databases, semantic models, and documentation
- Build portable analytics skills packaging DAX patterns, SQL templates, Fabric Notebook snippets, and data modeling best practices into reusable agent expertise across the entire Microsoft data stack
- Architect multi-agent workflows using specialized subagents for Fabric pipeline automation, Notebook generation, DAX optimization, and semantic model development
- Design subagents for code review, testing, documentation, and end-to-end solution generation spanning SQL Server, Fabric Lakehouse, semantic models, and Power BI reports
Experience live demonstrations of AI agents building Power BI solutions end-to-end—from environment setup through autonomous pipeline maintenance—and walk away with a fully configured toolkit ready for immediate use.
- Target Audience: BI developers, data engineers, analytics engineers, Power BI developers ready to adopt AI-assisted development
- Format: 45-minute talk, 90-minute session, or full-day hands-on workshop (with live demonstrations)
- Takeaways: Environment setup guide, starter skill templates, MCP server configuration examples, Power BI MCP usage guide, subagent configuration examples
- Prerequisites: Experience with Power BI/DAX or SQL development, basic familiarity with code editors
- Level: Beginner to advanced (progressive journey from setup to advanced orchestration)
- Topics Covered: VS Code, GitHub Copilot, Claude Code, Model Context Protocol (MCP), AI Skills, Subagents, Microsoft Fabric, Fabric Notebooks, SQL Server, Power BI
From Prototype to Production: Turn Power Query into Scalable Data Pipelines with AI en
Power Query is your secret weapon for rapid prototyping—and now it can become the bridge between analytics and engineering teams. Leverage the business logic you've already perfected in Power Query as a shared design language, then seamlessly convert proven prototypes into production-grade Fabric pipelines that scale to enterprise data volumes.
What you'll master:
- Apply Power Query as a rapid prototyping tool that validates transformation logic and communicates requirements to data engineering teams in a language both sides understand
- Implement Medallion Architecture (Bronze, Silver, Gold) to structure scalable, maintainable data pipelines that serve both BI and engineering needs
- Convert Power Query prototypes to Fabric Notebooks preserving business logic while gaining enterprise performance and orchestration
- Design effective handoff documentation** that translates Power Query transformation steps into clear data engineering requirements with testable acceptance criteria
- Leverage AI coding agents and skills to auto-generate Fabric Notebooks from Power Query prototypes, validate transformations, and accelerate the transition from prototype to production code
- Build end-to-end Fabric Data Pipelines with orchestration, error handling, and incremental refresh patterns—using AI-assisted development techniques throughout
Prototype fast in Power Query, align your teams around a shared specification, and deploy production pipelines that scale to billions of rows—turning your existing BI expertise into a data engineering superpower.
- Target Audience: Power BI developers expanding into data engineering, analytics engineers, data engineers collaborating with BI teams, team leads managing analytics-to-engineering handoffs
- Format: 45-minute talk or full-day hands-on workshop
- Takeaways: Medallion Architecture templates, Power Query to Notebook conversion guide, requirements handoff template for analytics-to-engineering collaboration, pipeline patterns
- Prerequisites: Intermediate Power Query experience, basic understanding of data pipeline concepts
- Level: Intermediate to advanced
- Topics Covered: Power Query, Microsoft Fabric, Fabric Notebooks, Medallion Architecture, Data Pipelines, Requirements Communication
Budapest BI & Analytics Forum 2026 Sessionize Event Upcoming
Data Platform Next Step Sessionize Event
Budapest Data+AI Forum 2026 Sessionize Event
SQLBits 2026 Sessionize Event
Birmingham Power BI Meetup Group #PBIBrum User group Sessionize Event
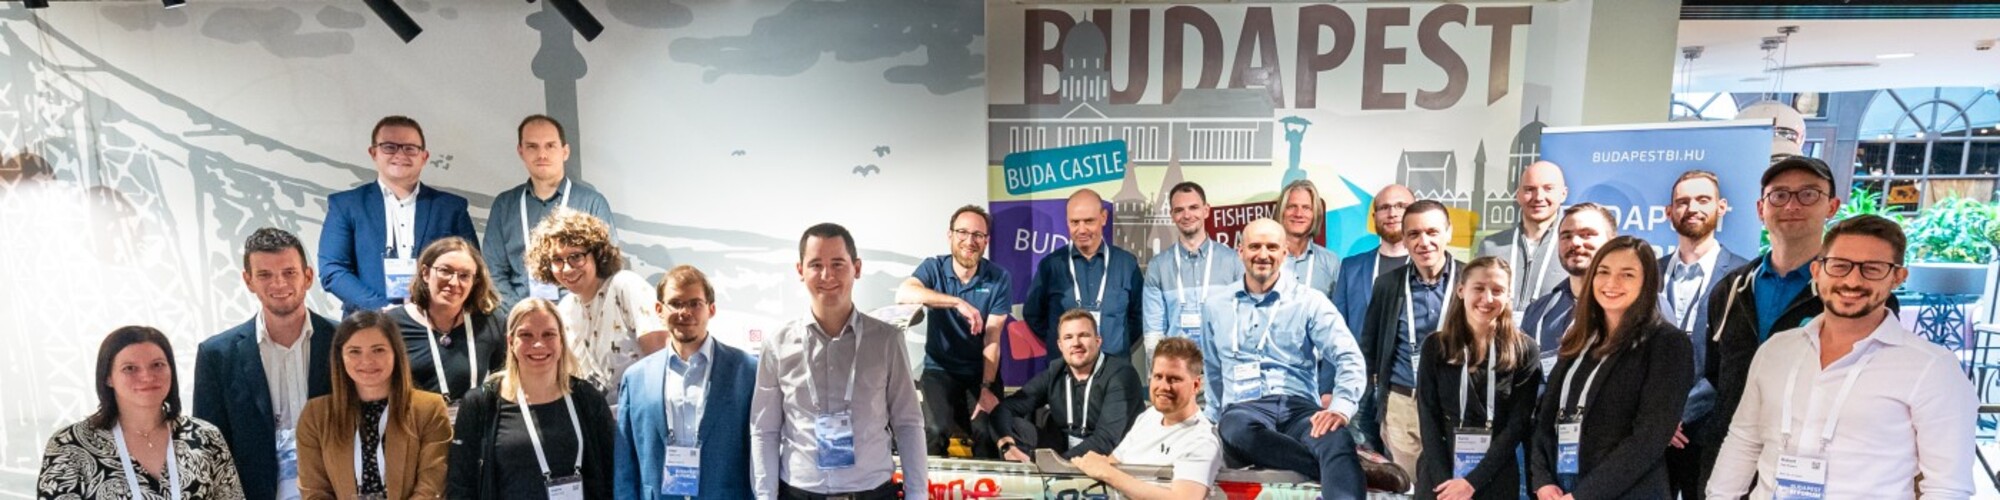
Budapest BI Forum 2025 Sessionize Event
PBI Community Session: Journey to Agentic Report Development
Enterprise Power BI Community with more than 3.500 members.
DATA:Scotland 2025 Sessionize Event
London Fabric User Group
Journey to Agentic Report Development
Budapest BI Forum 2024 Sessionize Event
East Midlands Data Meetup
Model Performance and Quality Analysis
Southampton Excel User Group
Advanced Excel PivotTable Techniques with Power BI
Southampton Microsoft Data Platform and Cloud user group
Model Performance and Quality Analysis & Increase your audience - Excel Integration in Power BI
Budapest BI Forum 2023 Sessionize Event
Mihaly Kavasi
Fasttrack Recognized Solution Architect, MCT, Founder of One Day BI
Southampton, United Kingdom
Links
Actions
Please note that Sessionize is not responsible for the accuracy or validity of the data provided by speakers. If you suspect this profile to be fake or spam, please let us know.
Jump to top